JuniperPublishers- An Exploratory Investigation of the Performance Effects of Competing on Home Versus Opponents’ Courts in Men’s and ’sWomen Intercollegiate Basketball Contests
Journal of Psychology-JuniperPublishers

Abstract
This study investigated the potential effects of home court advantage (HA) or disadvantage (HD) in recent (2013-2016) Division I men’s and women’s college basketball games. Performance statistics (points scored, points allowed, rebounds, free throw percentage, field goal percentage, fouls committed and winning percentage) were analyzed from two mid western (1 men & 1 women) and two southeastern (1 men & 1 women) Division I teams. Data were collected from each team’s regular season games (N = 329) over the course of a three-season period. Based on previous literature, it was anticipated a slight advantage would be found for teams playing at home versus playing at the opponents’ locations. Current findings showed an advantage for teams playing at home, though this advantage was not seen in all performance categories. All teams showed significant increases in points scored, field goal percentage, rebounds and winning percentage. All teams also experienced decreases in points allowed and fouls committed at home. In addition, consistent with Baumeister & Steinhilber [1], results indicated three of four teams had a decrease in home free throw percentage. Instead, while playing on an opponent’s court the men’s teams saw free throw percentage increase by an average of 2.61% and the women’s teams indicated a less substantial change.
Abbreviations: ACC: Atlantic Coast Conference; SEM: Southeastern Men; SEW: Southeastern Women; MWM: Midwestern Men; MWW: Midwestern Women; PS: Points Scored; PA: Points Allowed; FGP: Field Goal Percentage; FTP: Free Throw Percentage; RE: Rebounds; FC: Fouls committed; WP: Winning Percentage; ANOVA: Analysis of Variance
Introduction
Basketball players, coaches, and spectators have long postulated whether playing games on their home court versus competing on an opponent’s court provided an emotional, psychological, or physical advantage. Studies in various sports (basketball, baseball & hockey) have indicated an advantage to playing at home. Though in other studies it has been shown that during the postseason, playing in front of home spectators may actually create a disadvantage. Research has suggested differing reasons for this phenomenon including crowd support, familiarity of playing environment, and judges’ biases.
One of the earliest investigations of HA was performed by Schwartz & Barsky [2] in baseball, basketball, football, and hockey. Findings confirmed the most pronounced advantage existed in the indoor sports of basketball and hockey (winning 65% of home games); less advantage was found in the outdoor sports of football and baseball (winning 53% of home games). Schwartz and Barsky concluded the advantage was gained due to audience size and the social support of the crowd rather than fatigue of the visitors or their unfamiliarity with the playing area.
Varca [3] examined the performance of men’s NCAA basketball programs (N=10) playing on both their home and opponent’s courts and found the teams playing at home won significantly more often (63 of 90 games or 70%) than their opponents and visiting teams displayed more dysfunctional aggressive behavior (committed more fouls). Varca also examined this phenomenon using different theoretical models; social facilitation, referee bias versus frustration-aggression, and social support. Unfortunately, due to confounding factors these models were not found helpful in explaining the HA. However, results indicated a HA existed and the home team more often than not outperformed the visitors in the functionally aggressive categories (rebounds, steals & blocks).
Silva & Andrew [4] examined the performance of college basketball teams participating in the Atlantic Coast Conference (ACC) as a function of home versus away game location during a 10-year period (1971–1981). Home versus away effects were analyzed for field goal percentage, free throw percentage, turnovers, personal fouls, and rebounds. Results indicated home teams won more games (65% of home games) and had a higher per game scoring average. Silva and Andrew also found four of the five performance variables favored home teams: they saw an increase in field goal percentage and rebounds and a decrease in turnovers and personal fouls.
Balmer et al. [5] investigated the HA of host countries for the Winter Olympic Games from 1908 -1998. Balmer et al. [5] proposed; subjectively judged events would display a much greater HA than other events; familiarity with the local conditions would result in an advantage for the host nation and travel would have a negligible effect. Some evidence of HA was found in figure skating, freestyle skiing, alpine skiing, ski jumping and short track speed skating. In contrast, little or no HA was observed in ice hockey, Nordic skiing, bobsled, luge or speed skating. When categorized together, significantly greater HA was seen in the subjectively judged events with home competitors scoring better than visiting competitors (p = 0.037). Familiarity of the local conditions was shown to have some effect, particularly in alpine skiing, but in other events, bobsled and luge, familiarity showed little or no advantage. No apparent trends or variances in performance due to the number of time zones or the direction traveled were found.
Anderson & Pierce [6] examined the pattern of foul calls during men’s NCAA basketball games during the 2004–2005 seasons. The investigators found officials had the tendency to call fouls on the team with fewer fouls, eventually evening out the number for each team during the game. In addition, it was also found officials called significantly more fouls on the visiting team. In fact, the chances of the next foul being called on the visiting team were as high as 70%.
Jamieson [7] examined HA in 10 different sports (baseball, golf, cricket, etc.), with an emphasis on potential variables that may increase the probability of a home victory. Multiple variables were considered in the study including; sport type, level of competition, time era, season length, game type, and sport. Overall HA was found in approximately 60% of the contests and it was found sport type, time era, season length, and game type all had an effect on the HA.
Baumeister & Steinhilber [1] examined whether a supportive home audience may actually be a disadvantage. Baumeister & Steinhilber [1] discussed “self-presentation” and “self-attention” as key contributors to this theory. Archival data from both baseball and basketball championship series from the years (1924-1982) were analyzed for performance comparisons. Self-presentation or the process of claiming desired identities through social, public performances was shown to occur more often when the crowd was supportive rather than hostile or unsympathetic. This desire to claim identity could interfere with the performance of skill based activities. Baumeister and Steinhilber observed in Major League Baseball, during a seven game championship series, games 1 and 2 were won 60% of the time by the home team. However, they found in the same series deciding games, specifically games 5-7, the home team’s only won 40% of the time. A similar trend was found when analyzing a seven game championship series in the National Basketball Association (1967-1982). Home teams won 70% of home games 1-4, yet the home winning percentages fell to 46% in the games 5-7.
Butler & Baumeister [8] tested the fine motor skills of participants by having them play a video game in which they were tasked with steering an airplane through an obstacle course as quickly as possible. Butler and Baumeister found when a supportive audience instead of a neutral audience was present, the performer’s completion times showed a significant decline, from 49.7s to 41.9s. Ironically, Butler and Baumeister found when surveyed the performers stated they preferred the supportive audience and thought they were actually performing better. The results suggested participants were unaware of the negative effects a supportive audience may have on performance and may choose emotional comfort over objective success.
Greer [9] examined the possible social origin of HA. Multiple men’s NCAA Division I college basketball games were attended by investigators who observed both home and visiting team performance during the times directly following spectator booing (a length of 15 seconds or more). The chosen performance variables included scoring, turnovers and fouls. Following episodes of crowd protest, the home team saw a slight improvement in these categories, whereas the visiting team saw a significant decline in performance. The visiting team showed a significantly large increase in the number of fouls committed. The poor play of visiting teams was attributed to the hostile crowd noise inhibiting their play rather than the noise clouding the judgment of the referees. In either case, the data was consistent with other studies that playing on a home court may have its advantages.
Based on the findings of the previous investigations of the HA or HD phenomena, the following research questions (RQ) were proposed:
RQ1. Does a HA or HD exist in women’s and men’s college basketball regular season games? If a HA or HD does exist, does it affect men’s and women’s teams differently?
RQ2. Do home or away teams commit more fouls in regular season games?
RQ3.Does playing on a home court versus an away court has an effect on free throw percentage in regular season games?
RQ4.Do home or away teams collect more rebounds in regular season games?
RQ5.Are teams more likely to score more points while playing on visiting courts or in front of a home crowd during regular season games?
RQ6.Are teams more likely to allow a greater amount of points while playing on visiting courts or a home court during regular season games?
RQ7.Do home or away teams have a higher field goal percentage during regular season games?
RQ8. Does playing in front of home or away crowds have an effect on winning percentage during regular season games?
Method
Participants
Participants included the men’s and women’s basketball teams from two NCAA Division I universities, one university was located in the southeastern United States [Southeastern Men (SEM) and Southeastern Women (SEW)] and the other university was located in the mid western section of the United States [Midwestern Men (MWM) and Midwestern Women (MWW)] – four teams overall. All data gathered was of historical and public records.
Data Collection and Performance Categories
The study analyzed all four teams’ data from the following categories: points scored (PS), points allowed (PA), field goal percentage (FGP), free throw percentage (FTP), and rebounds (RE), fouls committed (FC), and winning percentage (WP). Data was collected from all regular season games for three seasons (2013 – 2016). All data was publicly accessible. All performance category data was then separated by location of the contest; home and away (neutral game data was collected but not included in the overall analysis due to the small sample size, and was therefore separated into a different chart for an separate consideration).
Descriptive statistics for summary totals and averages were computed for the main categories of points scored (PS), points allowed (PA), field goal percentage (FGP), free throw percentage (FTP), rebounds (RE), fouls committed (FC), and winning percentage (WP). As a second step to compare and validate results of the descriptive statistics, a statistical Analysis of Variance (ANOVA) was utilized for determining if any significant differences occur when comparing between the means of groups for home and away games within the categories of PS, PA, FGP, FTP, RE, and FC. As WP contains a summary of individual game statistic this category was omitted from the ANOVA statistical tests. For example, points scored for each team was compared when playing home games versus away games. These similar comparisons were completed for each performance category and men’s and women’s teams.
Results
Home vs. Away
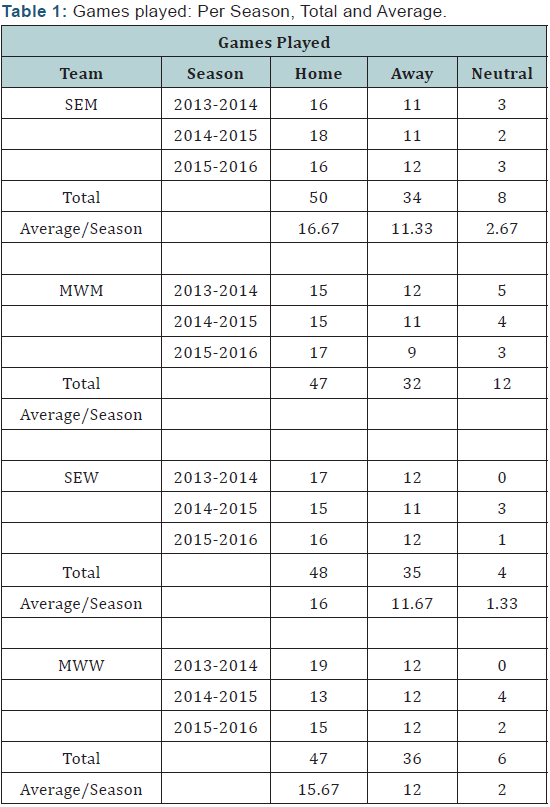
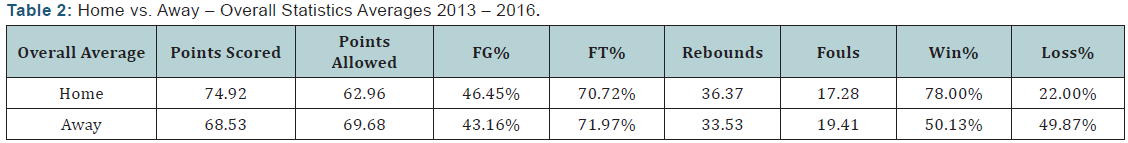
(Table 1) shows the amount of games each team played during each season on home, away and neutral courts. (Table 1) also displays a combined total per team as well as an average per team of how many games were played home, away and on neutral courts over the three year period. In (Table 2) includes a side-by-side comparison of the combined averages of all four teams’ home games and away games. (Table 2) figures show a rise in PS, FGP, RE and WP and a decline in FC, PA and FTP while playing on a home court.
Women’s and Men’s Teams
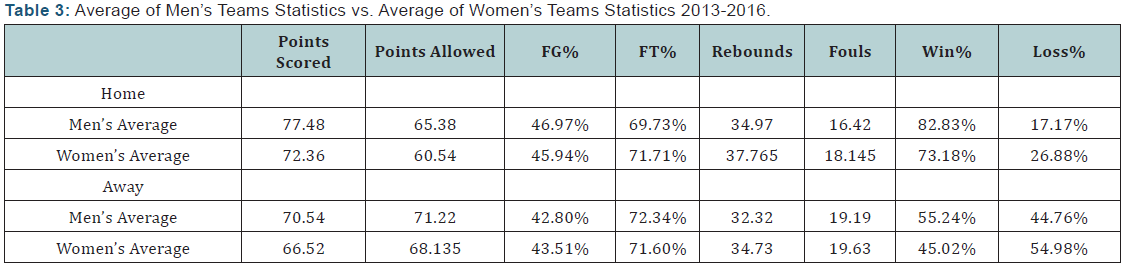
When analyzing the combined statistics of men’s and women’s teams, (Table 3) shows game location had a similar effect on all but one of the categories (free throw percentage). Both men’s and women’s teams scored more points, allowed fewer points, had a higher FGP, collected more RE, committed less fouls and won more games while at home. Overall analysis results demonstrated a statistically significant (p0.01) comparison of means for PS, FGP, RE, FC, and PA between home and away games. FTP was the only performance category to show a difference between genders. The men’s teams shot 2.61% better while on an opponent’s court and the women’s team showed a less than significant difference between home and away games see (Table 3). Overall analysis results demonstrated a statistically nonsignificant (p=0.861) comparison of means for FTP.
Men’s Teams
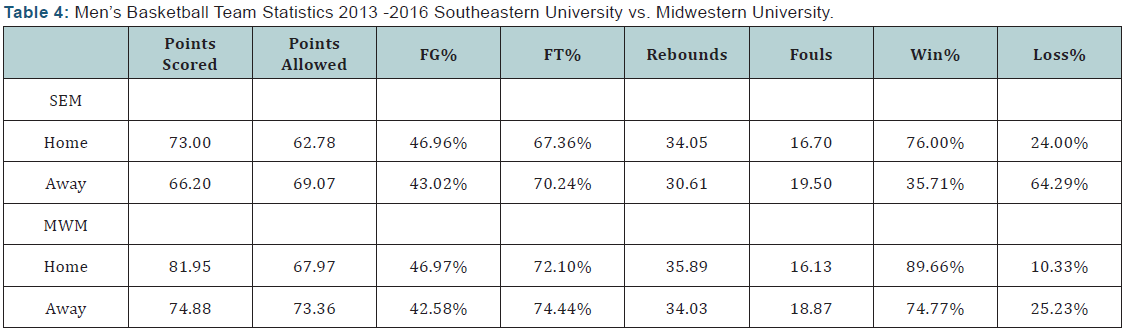
Both men’s basketball programs on average scored more points while competing on their home courts see (Table 4). Though the total PS varies, the home/away differential is very similar. SEM scored 6.8 more points on a home court versus an away court, while MWM scored 7.1 more points when at home versus away. Complimentary to the scoring trend was the similarity between the team’s FGP, WP and PA, performing best in all categories while at home. SEM allowed 6.29 fewer points per game at home and MWM allowed 5.99 fewer points while at home. The inverse is shown in the categories of FC and FTP, with both teams committing more fouls and having higher FTP while on an opponents’ court. MWM averaged a higher FTPon away court (74.44%) as did SEM, (70.24%). MEM committed an average of 2.74 more fouls during away games and SEM showed a similar gain at an average of 2.8 more FC per game on the road vs. home games. Analysis results demonstrated a statistically significant comparison of means for PS, FGP, FC, and PA at the 0.01 levels and RE at the 0.05 level between home and away games for Men’s teams. Results demonstrated a statistically nonsignificant (p=0.170) comparison of means for FTP.
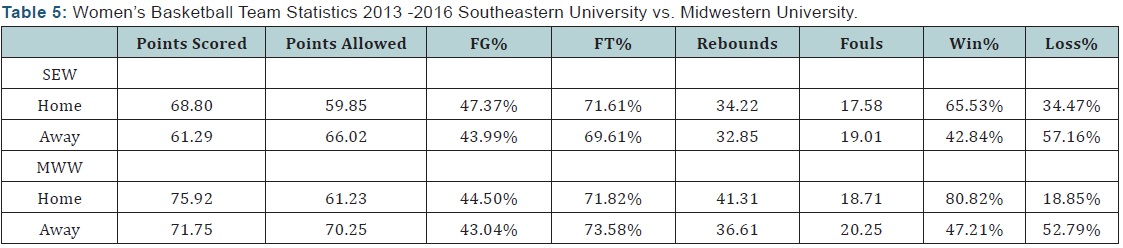
Women’s Teams
The two women’s teams showed similar venue preference in all seven categories. See (Table 5). Both teams averaged more PS on their home courts, while scoring less while playing on an opponent’s court. Both teams also saw an increase in FGP while at home as well as WP and RE. The teams also mutually displayed an increase in FC, FTP and PA while on the road. Similar to men’s teams, analysis results demonstrated a statistically significant comparison of means for PS, FGP, RE, FC, and PA at the 0.01 level. Results demonstrated a statistically non-significant (p=0.985) comparison of means for FTP.
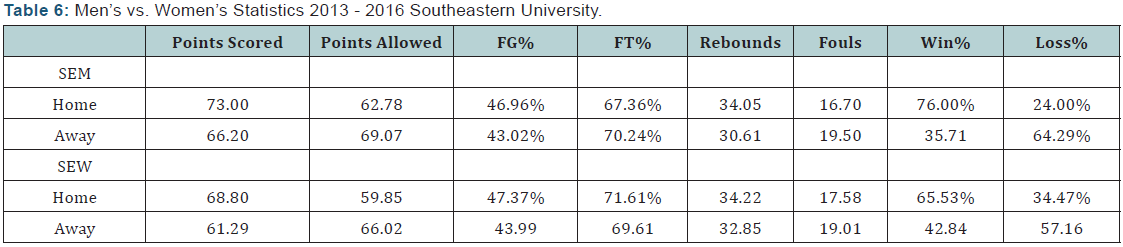
As shown in (Table 6), the men’s and women’s teams of the southeastern university showed similar results in the categories of PS and WP. Similar findings were observed between the men’s and women’s teams located in the mid west.
SEM showed superior performances for the home contests, having performed better in every category when playing at home, except for FTP which was higher during away games. Unlike SEM, SEW’s FTP was better when playing at home. Analysis demonstrated a statistically significant (p0.01) comparison of means for PS, FGP, RE, FC, and PA at the 0.01 level while playing on a home court for SE teams. Analysis results demonstrated a statistically non-significant (p=0.924) comparison of means for FTP.
Midwestern Teams
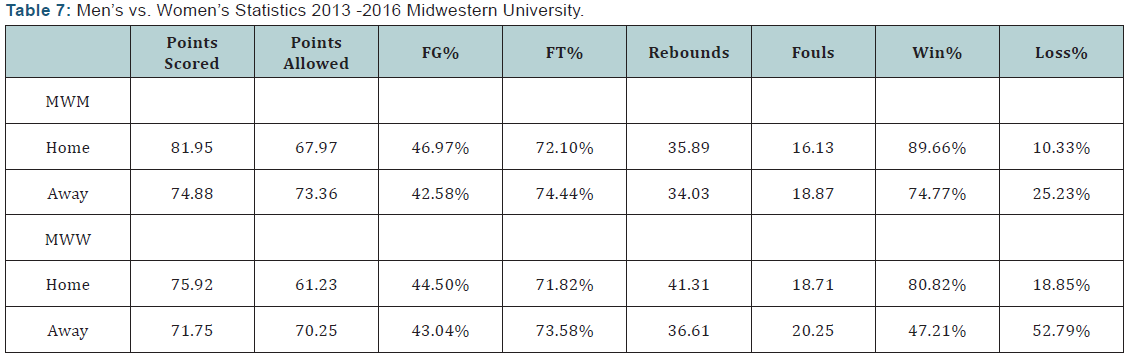
As shown in Table 7, the mid western university’s men’s and women’s teams saw the same decreases and increases in all categories when playing at home or on the road. Similar to earlier results, analysis demonstrated a statistically significant (p0.01) comparison of means for PS, FGP, RE, FC, and PA at the 0.01 level while playing on a home court for MW teams. Analysis results demonstrated a statistically non-significant (p=0.924) comparison of means for FTP. Though the teams saw a similar trend in the direction each category changed, the amount of changed did vary. Both teams averaged approximately 14 more points than their opponents while at home and both teams also averaged approximately 1.5 more points than their opponents while on the road see (Table 7). Both teams had a higher WP while playing at home. However, the decline in WP when on the road was far greater for MWW, a decrease of 33.61%, than it was for MWM, a decrease of 14.89%. Both teams also showed a decline in RE collected when playing on an opponent’s court, though MWM only declined by 1.86 RE and MWW declined by 4.7 rebounds. In the category of field goal percentage (FGP), MWW only showed a decline of 1.46% when playing on an opponent’s court, while MWM’s FGP declined by 4.39%.
Neutral Games
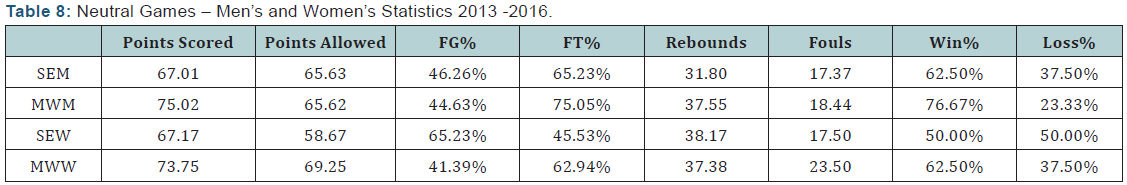
Any comparison between neutral game statistics and home/ away statistics are inconclusive due to the small sample size (N = 30) and the variance in the amount of games played by each of the four teams, see (Table 8). Initial analysis results demonstrated a statistically significant comparison of means for PS, RE, and PA and statistically non-significant comparison of means for FGP, FTP, and FC while playing neutral court. The SEM team competed in 8 contests on neutral courts and the SEW team competed in 4. The MWM competed in 12 games at a neutral site and the MWW compete in 6.
Conclusion
The primary objective of this study was to compare the home and away game performances of two Division I men’s and women’s basketball programs (four teams overall). Two teams (1 men’s & 1 women’s) were selected from two different United States regions; southeastern and mid western. Each team’s home and away contests were analyzed in the following performance categories: points scored (PS), points allowed (PA), field goal percentage (FGP), free throw percentage (FTP), and rebounds (RE), fouls committed (FC), and winning percentage (WP).
The current study showed a significant HA existed in both men’s and women’s college basketball games in all of the following performance categories: points scored (PS), points allowed (PA), field goal percentage (FGP), rebounds (RE), fouls committed (FC), and winning percentage (WP).
These current PS and WP findings were consistent with previous research (Varca, 1980; Silva & Andrew, 1987;) which found teams scored more points and won more games at home compared to when playing on the road. The southeastern (SEM) men’s team scored 6.8 points more at home, while the mid western (MWM) men’s team scored 7.1 more points at home. Similar point differentials were found with the southeastern (SEW) women’s team scoring 7.5 more points at home and the mid western (MWW) women’s team scoring 4.1 more points on their home court. These results were consistent with Silva & Albert’s [4] findings that indicated ACC men’s basketball teams scored more points and won more often when playing at home. Further support of increased home points scored may be found in the work of Riberio et al. [10]. The researchers studied 16,000 National Basketball Association (NBA) games over a 13 year period and found scoring rates (time between a team scores per minute of play) to increase at home versus road games.
Additional support for the increase in PS while at home may lie in the perceived positive reinforcement the home team receives from their home crowd. Schwartz & Barsky [2] found indoor sports (basketball and hockey) won a greater percentage of home games (65%) compared to outdoor sports (53%), reasoning crowd size and social support to be leading advantages for the home team. Lastly, an explanation for the home teams increased PS and WP may also be influenced by how the crowd reacts to calls against the home team. Greer [9] found home teams had slight improvement in PS immediately after episodes of crowd protests.
An additional finding consistent with previous literature was three of the four teams had a lower free throw percentage at home than on the road. Schlenker & Leary [10] believed a supportive home crowd could actually increase a player’s selfawareness which in turn, could cause a player to over think skill performance. Baumeister & Steinhilber [1] found home teams to experience a disadvantage in free throw percentage and postulated the home crowd could force the players to place more pressure on themselves when playing in front of the home team crowd. Thus, increased self-awareness based on a myriad of factors (game situations, family in crowd, peer pressure) could negatively impact home performance. These higher self-awareness concerns may directly influence performance. Wilson et al. [11] found heightened anxiety levels negatively impacted free-throw shooters because of its effect on a shooters “quiet eye” period (period of time for final fixation on target). Conversely, the away environment might force a player to narrow his/her focus due to the crowd actions behind the basket. These findings call for more research on player focus direction when performing the skill of free throw shooting in the two different environments.
In addition, Anderson & Pierce [6] found evidence basketball officials tended to call more fouls on visiting teams than home teams. Thus, home teams possibly head to the free throw line more often than on the road and in turn will take more shots - and as FGP showed made more of the shots taken. Coaches may advise players to take more shots when on the road, which may lead to an increase in scoring [12].
The current study indicated three of four teams (excluding SEW) had a higher free throw percentage when not on their home court. This was the only category to see a benefit for the traveling team. The idea a player may over analyze his or her movements in front of a home crowd are known as “self-attention” Baumeister & Steinhilber [1]. Considering the distracting tactics opposing fans use to attempt to distract visiting players and the adverse effect it seems to have, maybe coaches should have home fans try to distract their own players while shooting free throws. Coaches may also ask the fans to not be distracting or be quiet while visiting teams are shooting free throws in the hope that it will play into the “self-attention” phenomenon.
team. The idea a player may over analyze his or her movements in front of a home crowd are known as “self-attention” Baumeister & Steinhilber [1]. Considering the distracting tactics opposing fans use to attempt to distract visiting players and the adverse effect it seems to have, maybe coaches should have home fans try to distract their own players while shooting free throws. Coaches may also ask the fans to not be distracting or be quiet while visiting teams are shooting free throws in the hope that it will play into the “self-attention” phenomenon.
Future studies may benefit from including a longer time period, at least five years is recommended so more roster changes on the teams will have occurred. Furthermore, these schools represented only two regions of the United States (southeast and mid west). Perhaps the inclusion of teams from the west coast, northeast and other geographical regions may lead to more robust findings of this phenomenon. Including colleges and universities from other NCAA levels should be observed to seek potential variations based on level of basketball competition.
In addition to the quantitative approach used this study, a combined quantitative and qualitative approach may prove to be extremely beneficial and help better understand athletes’ indepth perceptions of performing at home versus away sites.
Future studies should also consider how athletes’ emotional or psychological states and/or traits this may effect on their performance at the differing game locations. For example, the level of state anxiety and/or confidence, when performing on a rival’s court in a hostile environment may vary (positively or negatively) from playing on a home court with family and friends in the stands. Consideration of these suggested additional variables may be helpful in explaining the various reasons performance differences may occur on home versus away game locations.
To read more articles in Journal of Psychology and Behavior
Please Click on https://juniperpublishers.com/pbsij/index.php
For More Open Access Journals in Juniper Publishers Click
on: https://juniperpublishers.com/journals.php


Comments
Post a Comment